
Plan results Preview
After Run Plan, Plan Results shows every year of the projection from several angles. Choose a view on the left.
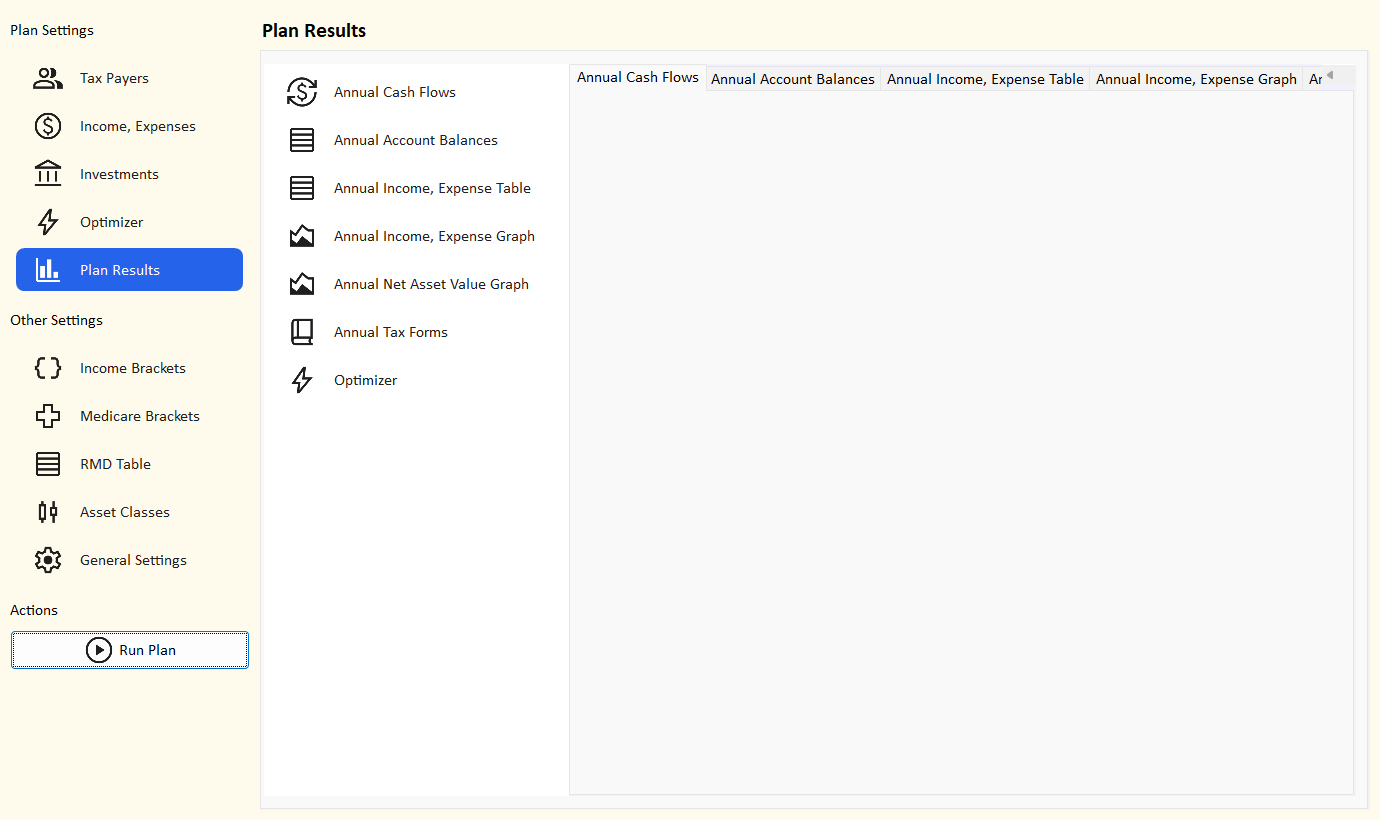
Annual Cash Flows
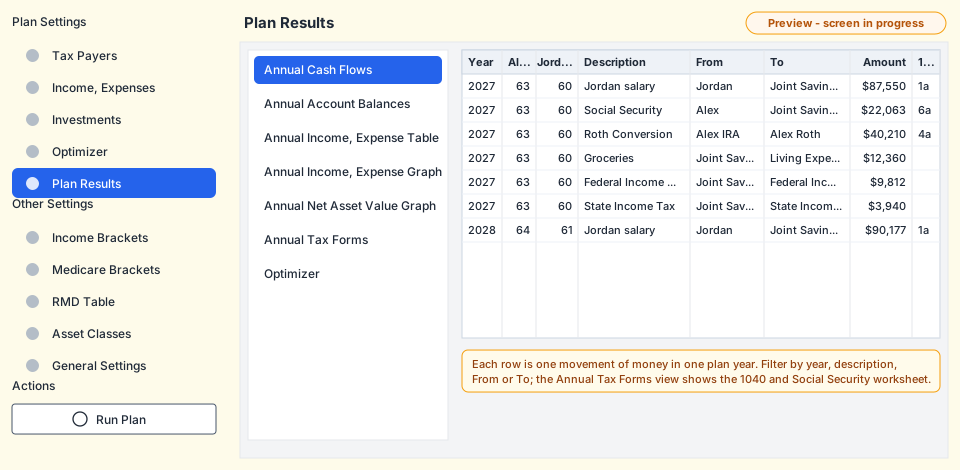
Every movement of money in every year: wages and pensions into accounts, Social Security and RMDs into the cash account, Roth conversions, and each withdrawal that paid an expense, a tax or Medicare.
| Column | Meaning |
|---|---|
| Year, ages | The calendar year and each tax payer's age. |
| Description | The income or expense name, or Social Security, Required Minimum Distribution, Roth Conversion, Federal Income Tax, State Income Tax, Medicare Premiums. |
| From, To | Where the money came from and went: a tax payer, a pension, an account, Auto, Living Expenses, a tax or Medicare. Renaming an account or tax payer renames it here too. |
| Amount | The amount in that year's dollars. |
| 1040 box | Where the flow appears on Form 1040 (1a wages, 4a IRA, 5a pensions and 401(k), 6a Social Security). |
Annual Account Balances
One row per account per year: starting balance, money in (deposits), money out (withdrawals) and ending balance. Ending minus starting, minus in, plus out is that year's market growth and yield.
Annual Income, Expense Table
Each income and expense item per year, including Social Security, federal and state income tax and Medicare premiums. RMDs and Roth conversions are not listed here, because they move your own money between accounts rather than add or spend it.
Annual Income, Expense Graph
Total income (wages, pensions and Social Security) against total expenses (living expenses, taxes and Medicare) for each year. Years where expenses are above income are paid from savings.
Annual Net Asset Value Graph
Net asset value (NAV) is the total of all your accounts at the end of each year. A NAV that falls toward zero before the end of the plan is a warning sign; if it reaches the point where a bill cannot be paid, the plan ends that year.
Annual Tax Forms
For every year, the Form 1040 lines and the Social Security benefits worksheet, as the planner filled them in.
| Box | Meaning | Box | Meaning |
|---|---|---|---|
| 1a, 1z | Wages | 9 | Total income |
| 2a | Tax-exempt interest | 11a | Adjusted gross income (AGI) |
| 2b | Taxable interest | 12e | Standard deduction (with age 65+ add-on) |
| 3a, 3b | Qualified / total dividends | 13b | Senior deduction (2025-2028) |
| 4a, 4b | IRA distributions (RMDs, conversions, withdrawals) | 14 | Total deductions |
| 5a, 5b | Pensions and 401(k) distributions | 15 | Taxable income |
| 6a, 6b | Social Security / taxable part | 16, 24 | Federal tax |
| 7a | Capital gain or loss (net loss limited to -$3,000) |
Three extra boxes are not on the real form. They are shown for clarity and highlighted in yellow:
| Box | Meaning |
|---|---|
| 7a.1 | Capital gain proceeds - what the sales brought in (Schedule D, 8a column d) |
| 7a.2 | Capital gain cost basis - what those investments cost (Schedule D, 8a column e) |
| 11a.1 | MAGI for Medicare IRMAA: line 11a + line 2a. See MAGI. |
Optimizer
One row per optimizer scenario. See reading the optimizer results.