
Asset classes: growth and yield
Every investment belongs to an asset class - domestic stocks, international stocks, bonds, municipal bonds, gold or cash. The class supplies real market history, long-run averages, and the tax treatment of what the investment earns.
Growth and yield are kept separate
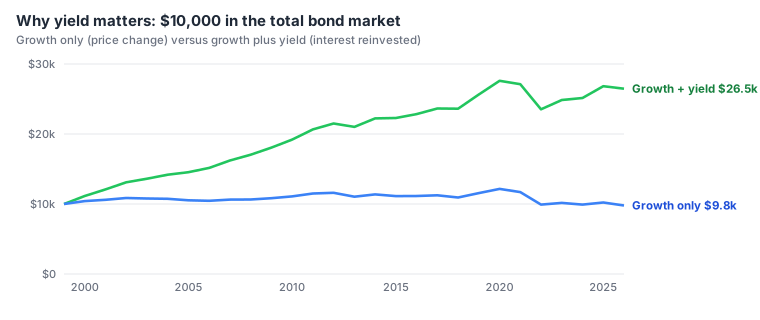
An investment earns money in two ways, and the planner tracks them separately because they are taxed differently:
- Growth is the change in price. It is not taxed until you sell, and then only the gain over what you paid (the cost basis) is taxed, at capital gain rates.
- Yield is the income the investment pays: dividends from stocks, interest from bonds and cash. In a taxable account it is taxed every year, even though the planner reinvests it.
Total return is growth plus yield. A fund's published return is a total return; the planner's data splits it into its two parts.
The six asset classes
| Asset class | Data source | Growth reported as | Yield reported as |
|---|---|---|---|
| DomStocks - domestic stocks | Vanguard Total Stock Market Index (VTSMX) | 7a capital gain | 3a qualified dividends |
| IntStocks - international stocks | Vanguard Total International Stock Index (VGTSX) | 7a capital gain | 3a qualified dividends |
| Bonds | Vanguard Total Bond Market Index (VBMFX) | 7a capital gain | 3b ordinary dividends |
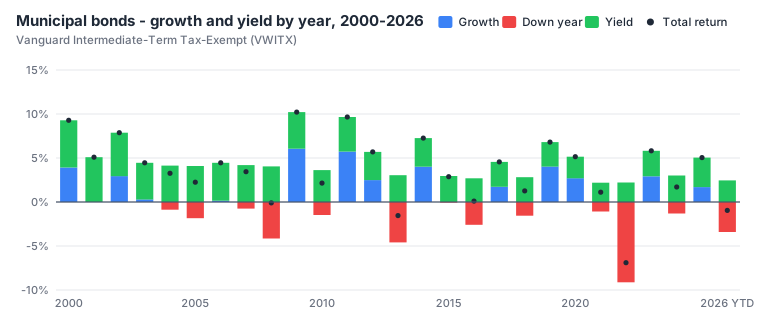
| MuniBonds - municipal bonds | Vanguard Intermediate-Term Tax-Exempt (VWITX) | 7a capital gain | 2a tax-exempt interest |
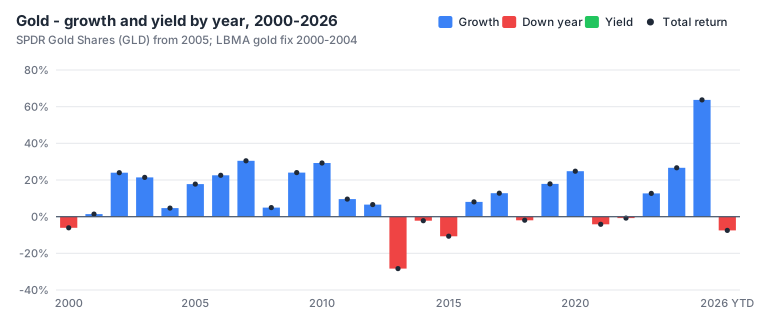
| Gold | SPDR Gold Shares (GLD) from 2005; LBMA gold price 2000-2004 | 7a capital gain | none |
| Cash | Held flat: 0% growth and 0% yield | none | 2b taxable interest |
The 1040 boxes matter only in taxable accounts (Savings, Checking, Brokerage). In an IRA or 401(k), withdrawals are ordinary income whatever the investment; in a Roth, HSA or 529 they are tax free.
Real market history, 2000-2026
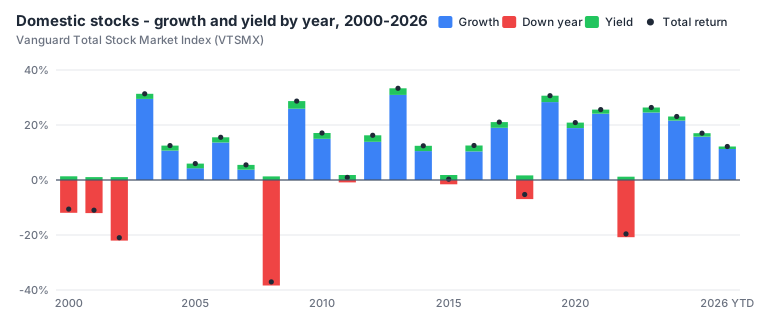
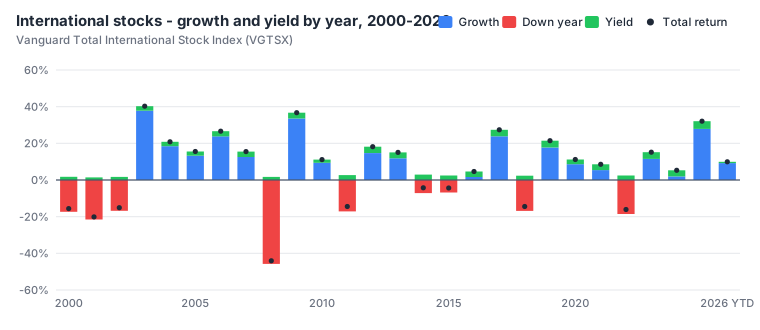
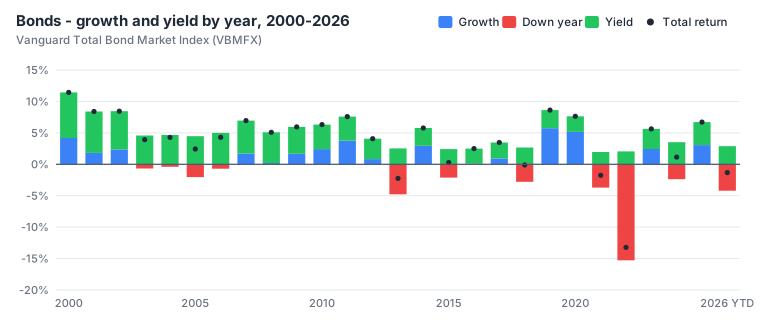
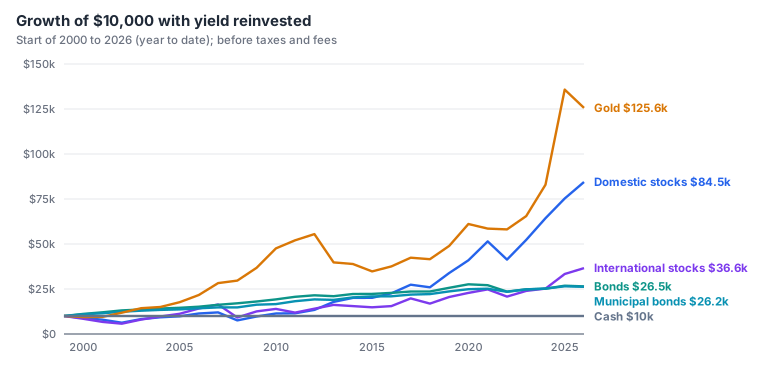
Each class is loaded with 27 years of real annual growth and yield, from 2000 through 2026 (2026 is the year to date). Blue bars are growth, red bars are years when the price fell, green is yield, and the dot is the total return.
Long-run averages (the normal market)
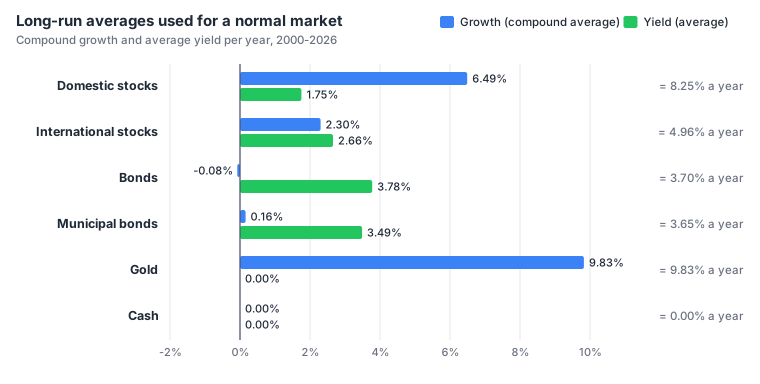
When you leave an investment's growth or yield blank, the normal market uses its class's long-run average over the whole history: the compound average growth (the steady rate that ends at the same place) and the simple average yield.
| Asset class | Growth | Yield | Total |
|---|---|---|---|
| Domestic stocks | 6.49% | 1.75% | 8.25% |
| International stocks | 2.30% | 2.66% | 4.96% |
| Bonds | -0.08% | 3.78% | 3.70% |
| Municipal bonds | 0.16% | 3.49% | 3.65% |
| Gold | 9.83% | 0.00% | 9.83% |
| Cash | 0.00% | 0.00% | 0.00% |
Stitching the history to cover the whole plan
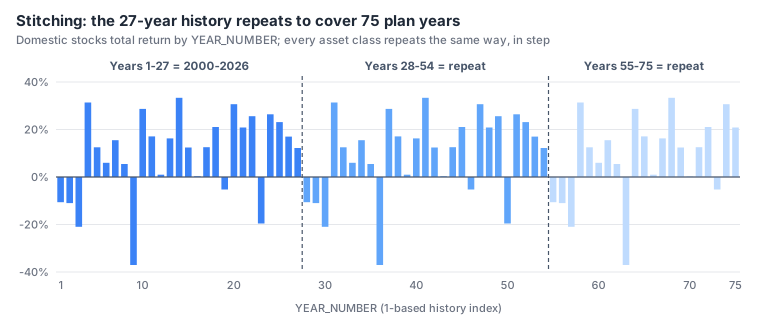
A plan can be longer than 27 years, so the history is repeated - "stitched" - out to 75 years: history year 28 is 2000 again, year 29 is 2001, and so on. Every class is stored the same way, with history year 1 = 2000, so the classes always move together exactly as they did in real life: when stocks fall in 2008, bonds do what bonds did in 2008.
Normal and down markets
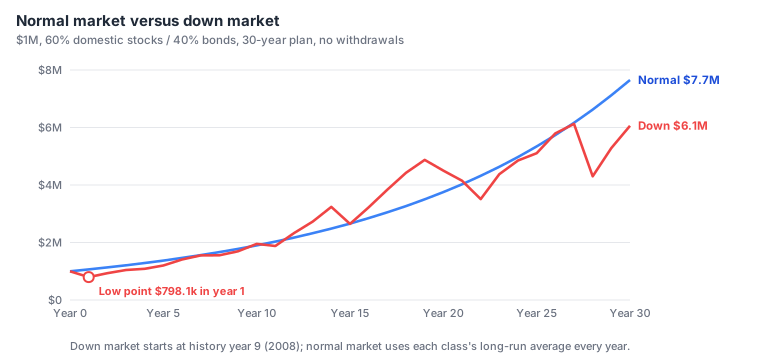
The down and flat market answers the question "what if the bad years come first?". The planner:
- blends the histories of the asset classes you actually own, weighted by today's balances;
- tries every possible starting year in the history and follows it for the length of your plan;
- picks the start that produces the deepest fall in value at any point.
Every investment then replays its own class's history from that year. In the example above (60% domestic stocks, 40% bonds, 30 years) the worst start is history year 9 (2008): a 20% fall in the first year, then the real recovery. Even though the market later recovers, a large early loss can sink a plan that is withdrawing money - this is called sequence of returns risk, and it is why the optimizer judges plans by the down market.