
How the plan works
The planner is a year-by-year simulation. It starts with today's balances and steps forward one calendar year at a time, applying the same steps every year, until the last tax payer's life expectancy year.
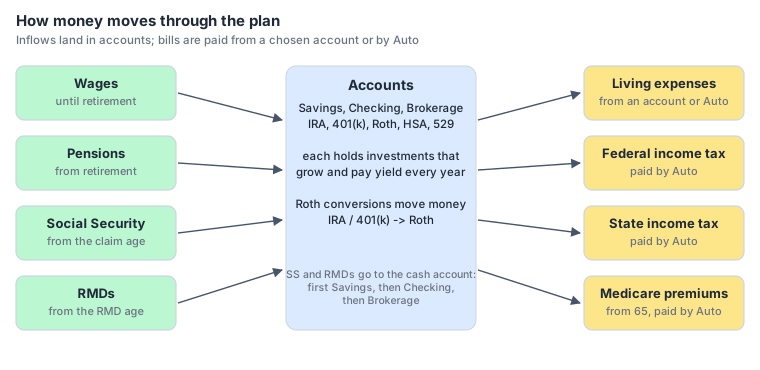
How money moves
Each year, step by step
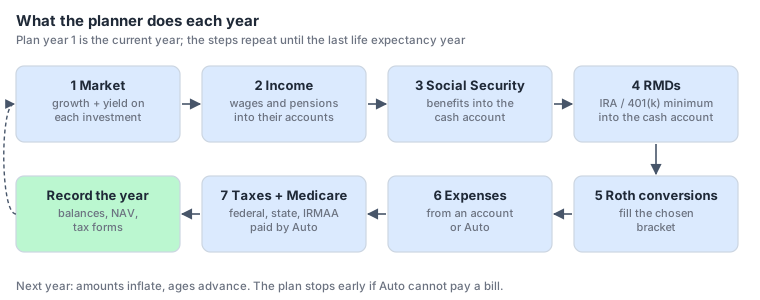
- Market. Every investment grows by its growth rate and earns its yield on the balance at the start of the year. Yield is reinvested; in taxable accounts it is taxed that year as interest, dividends or tax-exempt interest. See asset classes.
- Income. Wages are paid until the retirement year and pensions from it, each between its start and end years, into the chosen account. See income and expenses.
- Social Security. From the claim age, each tax payer's benefit is paid into the cash account. See Social Security.
- RMDs. From the RMD start age, the required minimum is taken from each IRA and 401(k) and paid into the cash account. See RMDs.
- Roth conversions. If the scenario fills a Roth bucket, IRA / 401(k) money is moved to a Roth until taxable income reaches the bucket's limit. See Roth conversions.
- Expenses. Each living expense is paid from its account or by Auto. See withdrawals and Auto.
- Taxes and Medicare. The year's federal and state income tax and Medicare premiums are worked out and paid by Auto. Because paying them can create more taxable income (for example an IRA withdrawal), the planner recalculates until the bill is fully paid. See taxes and Medicare.
The planner then records the year: account balances, cash flows, income and expenses, net asset value and the tax forms.
Inflation and today's dollars
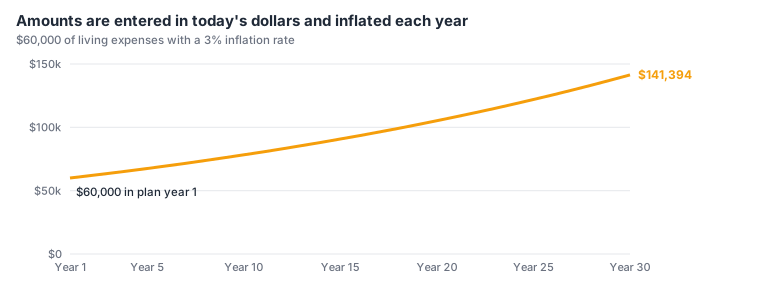
All amounts are entered in today's dollars. Plan year 1 uses them as entered; each later year multiplies them by (1 + inflation rate) for every year since plan year 1. Four rates are used:
- each income and expense's own inflation rate (default: the general rate);
- the general inflation rate for Social Security cost-of-living increases;
- the tax forms inflation rate for tax brackets, deductions, Roth buckets and IRMAA thresholds;
- the Medicare premium inflation rate for Medicare premiums.
Results are shown in the dollars of each year (nominal dollars). To compare a far-future amount with today, divide by the growth from inflation; at 3% a dollar in year 30 buys about what 42 cents buys today.
The plan horizon and how a plan ends
- Plan year 1 is the current calendar year (the start of plan,
SOP). - The plan runs through the last life expectancy year of the tax payers (
YODALL). - A tax payer's wages, pension and own Social Security stop after their life expectancy year. The survivor keeps the larger Social Security benefit and files single from the next year.
- If Auto cannot pay a bill because every account it can use is empty, the plan ends that year. The results show where it stopped: that is the year the money ran out.
Two market scenarios
Every plan can be run in a normal market (each investment earns its own growth and yield, or its asset class's long-run average) or a down and flat market (every investment replays its asset class's real 2000-2026 history, starting at the worst point for your holdings). Run Plan uses the normal market; the optimizer runs both. See normal and down markets.
Assumptions and simplifications
The planner keeps the model understandable. Know these limits when you read the results:
- Timing. Each year is calculated as one step. Growth and yield apply to the balance at the start of the year, so money deposited during a year starts growing the next year.
- Deductions. The standard deduction (with the 65+ add-on and the 2025-2028 senior deduction) is always used; itemized deductions and credits are not modeled.
- Capital gains. Sales use average cost, and every gain is treated as long-term. A net capital loss is limited to $3,000 a year, with no carryforward. Gold is taxed like other capital gains (real gold funds can be taxed at up to 28%).
- Penalties. There are no early-withdrawal penalties for IRA or 401(k) money taken before 59½.
- State tax. State tax uses the state brackets on federal taxable income plus tax-exempt interest; state-specific rules (such as exempting Social Security or pensions) are not modeled.
- Social Security. A survivor receives the deceased's benefit only if the deceased had already claimed it; survivor reductions are not applied. Benefits for a living spouse based on the other's record (spousal benefits) are not modeled - enter the higher of the two in each person's own estimate if that applies to you.
- Roth conversions fill the bucket before the year's expenses and taxes are paid, so later withdrawals can push taxable income above the bucket's limit.
- No rebalancing. Each investment grows on its own; new money is split by Mix and withdrawals are proportional to balance.